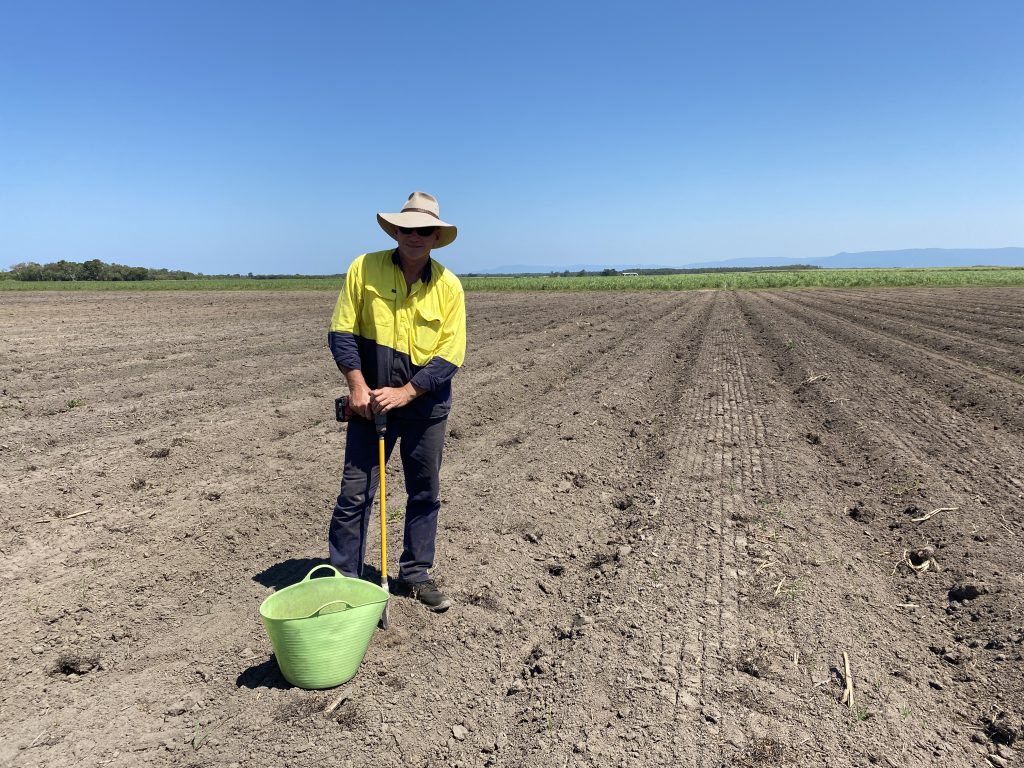
Fermentation in cane has long been known to reduce Commercial Cane Sugar (CCS) levels. In the field it can be caused by pests, disease, flooding, frost, drought, lodged cane, long delays between cutting and crushing, overly mature cane, two-year crop cycles and even burnt cane. Recent extreme weather has made this problem more important. As cane ferments, sucrose is broken down and many new products are formed. At the same time, suckering can increase fibre and water, which further lowers sucrose concentration.
The commercial measure of sucrose concentration (CCS) is calculated via the CCS formula using Pol, Brix and Fibre measurements. However, the National Measurement Institute Method for Pol states that Pol is a good estimate of sucrose when sucrose is the only ‘optically active’ substance in the sample, and where other constituents are not significant.That assumption is reasonable for healthy cane, but not for fermented cane. Fermented cane contains larger amounts of other ‘optically active’ compounds, so the Pol reading no longer reflects sucrose as well. For example, fermentation by a single bacterium, Leuconostoc mesenteroides, can produce glucose, fructose, ethanol, lactic acid, acetic acid, alternan, mannitol, levan, and dextran¹. These substances have optical rotations that differ from sucrose, which increases measurement error for fermented cane.
Online Near-Infrared (NIR) systems were first implemented in Australian sugar mills in 1998 for cane payment, process control, and quality assurance. The current instruments used in the mills for cane analysis are diode-array NIR units. NIR is a secondary method – its calibrations are built using laboratory reference results and matching NIR spectra. To explain: you get a laboratory result from a sample, scan that same sample many times with the NIR device, and build an algorithm – a sequence of instructions that a computer can use to solve a well-defined problem. When you see a new sample, you scan it with the NIR and it gives you a prediction. That process is called calibration: you build a mathematical model that predicts from the observed population. Its performance is checked by comparing laboratory values with NIR predictions and adjusting where needed.
An earlier version of calibration software was only able to use one calibration population at a time. This forced calibrators to choose between including fermented cane – resulting in a disproportionate increase in error for the whole data set – or excluding it and getting elevated Pol results for fermented cane samples.In practice, fermented cane is usually excluded, but this causes NIR Pol to be too high compared with laboratory Pol for fermented samples.
A milling project undertaken by SRA’s NIR Senior Engineer Joel Simpson, NIR Service Leader Steve Staunton and NIR Developer Phil Lethbridge, was presented at the recent ASSCT Conference in Mackay. It aimed to:
- develop a classification system for three fermentation levels named as juice (healthy), beer (fermented), and wine (heavily fermented)
- build separate prediction calibrations for each level
- create software that uses the correct calibration based on the classification result, and
- test whether this method improves prediction of Pol-related measurements.
Initial desktop studies showed the idea could work, so field testing was carried out at four sugar mills: Condong, Broadwater, Harwood, and Mulgrave. A new software system called NCS5 was developed and tested alongside existing online NIR systems. The new approach predicted Pol more accurately for fermented cane and also indicated how fermented the cane supply was. This calibration method could also be useful for other NIR problems in the future, such as fibre prediction when ash levels are high or low.
References: Robyt and Walseth (1979), Côté and Robyt (1982), Vandamme and Raemaekers, Vekemans, and Soetart (1996), Grobben et al. (2001) and Erten (1998).